- 您现在的位置:买卖IC网 > Sheet目录323 > DV164131 (Microchip Technology)KIT STARTER PICKIT 3
�� �
�
�Theory� of� Operation�
�2.6.1�
�Sequence� of� Operations� Leading� to� Debugging�
�Given� that� the� requirements� for� debugging� (see� previous� section)� are� met,� these�
�actions� can� be� performed� when� the� PICkit� 3� programmer/debugger� is� set� as� the� current�
�debugger� from� the� MPLAB� IDE� menu� (� Debugger>Select Tool>PICkit 3� ):�
�?� The� application� code� is� compiled/assembled� by� selecting� Project>Build�
�Configuration>Debug� .�
�?� When� Debugger>Program� is� selected,� the� application� code� is� programmed� into�
�the� device’s� memory� via� the� ICSP� protocol� as� described� above.�
�?� A� small� “debug� executive”� program� is� loaded� into� the� high� area� of� program�
�memory� of� the� target� device� automatically� by� MPLAB� IDE.� Since� the� debug�
�executive� must� reside� in� program� memory,� the� application� program� must� not� use�
�this� reserved� space.� Some� devices� have� special� memory� areas� dedicated� to� the�
�debug� executive.� Check� your� device� data� sheet� for� details.�
�?� Special� “in-circuit� debug”� registers� in� the� target� device� are� enabled.� These� allow�
�the� debug� executive� to� be� activated� by� the� debugger.�
�?� The� target� device� is� held� in� reset� by� keeping� the� V� PP� /MCLR� line� low.�
�2.6.2�
�Debugging� Details�
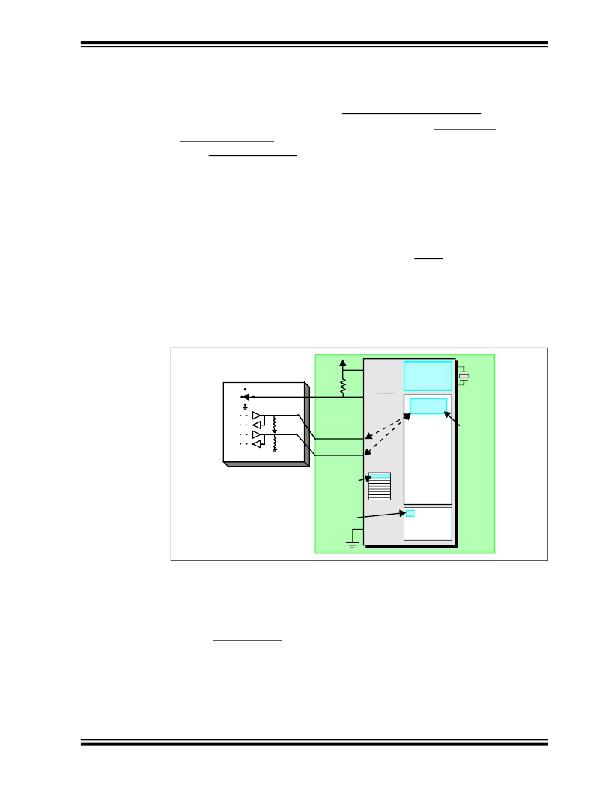
�Figure� 2-7� illustrates� the� PICkit� 3� programmer/debugger� system� when� it� is� ready� for�
�debugging.�
�FIGURE� 2-7:�
�PICkit?� 3� DEBUGGER� READY� FOR� DEBUGGING�
�V� DD�
�Internal�
�Debug�
�Registers�
�Target�
�must�
�be�
�Running�
�+5V�
�+12V�
�Internal� Circuits�
�4.7� k� Ω�
�4.7� k� Ω�
�1�
�5�
�V� PP� /MCLR�
�PGC�
�Debug�
�Executive�
�Program�
�for� Debug�
�Executive�
�to� Function�
�Area�
�Reserved�
�for� Debug�
�Executive�
�4�
�Hardware�
�Stack� Shared�
�by� Debug� Exec�
�Area� Used� by�
�Debug� Exec�
�PGD�
�Memory�
�File�
�Registers�
�Typically,� in� order� to� find� out� if� an� application� program� will� run� correctly,� a� breakpoint� is�
�set� early� in� the� program� code.� When� a� breakpoint� is� set� from� the� user� interface� of�
�MPLAB� IDE,� the� address� of� the� breakpoint� is� stored� in� the� special� internal� debug�
�registers� of� the� target� device.� Commands� on� PGC� and� PGD� communicate� directly� to�
�these� registers� to� set� the� breakpoint� address.�
�Next,� the� Debugger>Run� function� or� the� Run� icon� (forward� arrow)� is� usually� pressed�
�from� MPLAB� IDE.� The� debugger� will� then� tell� the� debug� executive� to� run.� The� target�
�will� start� from� the� reset� vector� and� execute� until� the� Program� Counter� reaches� the�
�breakpoint� address� previously� stored� in� the� internal� debug� registers.�
�After� the� instruction� at� the� breakpoint� address� is� executed,� the� in-circuit� debug�
�mechanism� of� the� target� device� “fires”� and� transfers� the� device’s� Program� Counter� to�
�the� debug� executive� (much� like� an� interrupt)� and� the� user’s� application� is� effectively�
�?� 2009� Microchip� Technology� Inc.�
�DS51795A-page� 21�
�发布紧急采购,3分钟左右您将得到回复。
相关PDF资料
DV164132
KIT EVAL F1 FOR PIC12F1/PIC16F1
DV243003
KIT STARTER FOR SRL MEM PRODUCTS
DVA1001
ADAPTER FOR PIC16F716 18DIP
DVA1004
DEVICE ADAPTER 8/14/20DIP
E3R-D12GP-P
RELAY RCVR PLUG-IN DIMMER
E3R-R12-3HOTP
RCVR 3WIRE RELAY 120V
E3R-R12GP
RCVR PLUG-IN RELAY
E3T-MICFP-40
CONVERTER 4-CH SLT SENSOR
相关代理商/技术参数
DV164131
制造商:Microchip Technology Inc 功能描述:PICKIT 3 DEBUG EXPRESS
DV164131-XLP
制造商:Microchip Technology Inc 功能描述:KIT DEV PICKIT 3-XLP/NANOWAT
DV164132
功能描述:开发板和工具包 - PIC / DSPIC F1 Evaluation Kit RoHS:否 制造商:Microchip Technology 产品:Starter Kits 工具用于评估:chipKIT 核心:Uno32 接口类型: 工作电源电压:
DV164132
制造商:Microchip Technology Inc 功能描述:PIC12F1xxx/PIC16F1xxx F1 Evaluation Kit
DV164133
功能描述:电源管理IC开发工具 Energy Harvesting Development Tool
RoHS:否 制造商:Maxim Integrated 产品:Evaluation Kits 类型:Battery Management 工具用于评估:MAX17710GB 输入电压: 输出电压:1.8 V
DV164136
功能描述:开发板和工具包 - PIC / DSPIC PIC18F DEV Kit (with PICkit 3) RoHS:否 制造商:Microchip Technology 产品:Starter Kits 工具用于评估:chipKIT 核心:Uno32 接口类型: 工作电源电压:
DV164139
功能描述:开发板和工具包 - PIC / DSPIC Lo PIn Count USB Dev Kit (w/PICkit 3) RoHS:否 制造商:Microchip Technology 产品:Starter Kits 工具用于评估:chipKIT 核心:Uno32 接口类型: 工作电源电压:
DV17K3225T
制造商:SEI Stackpole Electronics Inc 功能描述:- Tape and Reel 制造商:SEI Stackpole Electronics Inc 功能描述:Var MOV 17VAC/22VDC 100A 27V 3225 SMD T/R